How does temperature affect Bolt EV's efficiency?
Posted by Wesley on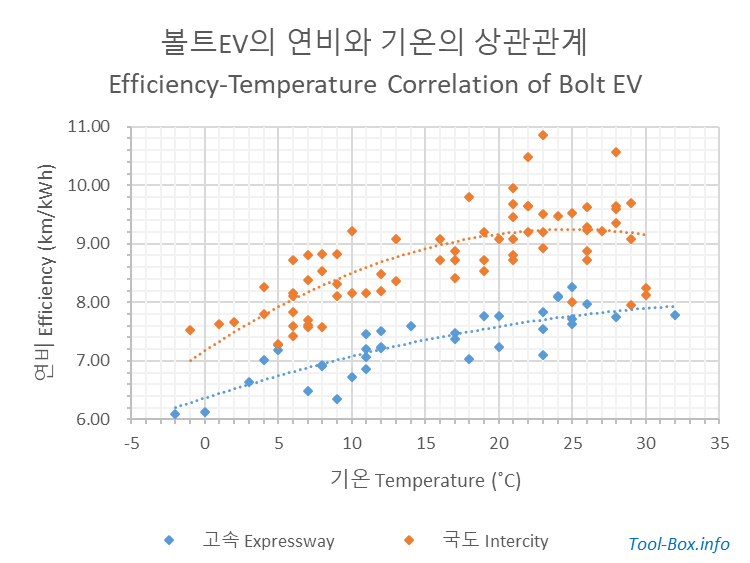
I keep a detailed log of my Bolt EV drives to gain insights to the questions I wanted answers to. One of them was this feeling that the drivable range was getting lower on a cold day despite the fact that I drive without having the heater on. Since my EV driving habits became consistent after driving for about half a year, I decided to analyze one full year's of driving from February 2019 to January 2020 to spot a trend between the ambient temperature and the car's efficiency ("fuel economy").
The results above speak for themselves. Even if you don't use a heater, the car's efficiency will certainly drop as the outside air gets colder. This is largely because the air itself becomes more dense, increasing resistance. Using a heater will impact efficiency on top of this. Meanwhile, driving at an average trip speed of about 50 km/h (30 mph) yielded about 1 to 1.5 km/kWh better efficiency than at about 80 km/h (50 mph). Again, less air drag meant better outcome.
If you want to know how the data points were chosen, please read on.
| Road Type | Speed Limit (km/h) |
Minimum % of Trip |
Trip Range (km) | Speed Range (km/h) | ||
|---|---|---|---|---|---|---|
| Min | Max | Min | Max | |||
| Expressway | 100 - 110 | 75 | 112.7 | 364.8 | 70.4 | 90.0 |
| Intercity | 70 - 90 | 19.6 | 25.3 | 40.6 | 69.0 | |
As all trips start and end within cities, the most significant and fastest road type used must take up at least 75% of the entire distance for a sample to be representative of a type. And to minimize impacts of traffic jams, average speed of a trip had to be at least 70 km/h for expressway and 40 km/h for intercity. Driving under rain or snow were also out in order to avoid other weather factors. Additionally, expressway trips had to be at least 100 km long and the intercity trips had to have no significant deviations from the most common 22 km-long route I take. Use of heater was completely avoided, while air conditioning was used very sparingly if needed and took up less than 1% of the battery consumption.
| Road Type | Total Trip (km) |
Average | Data Count | ||
|---|---|---|---|---|---|
| Trip (km) | Time (H:M:S) | Speed (km/h) | |||
| Expressway | 9,036.7 | 251.02 | 3:10:03 | 79.25 | 36 |
| Intercity | 1,593.1 | 22.13 | 0:26:20 | 50.41 | 72 |