Picking up and unboxing the Apple Vision Pro
Posted by Wesley on
Apple launched its first so-called spatial computing device called Vision Pro on February 2, 2024, only in the United States. As someone who had keen interest in wearable computers for quite some time, and is big fan of all things Apple, I had to get my hands on a set. So I was able to make it to Apple The Grove in Los Angeles on the launch day and do just that.
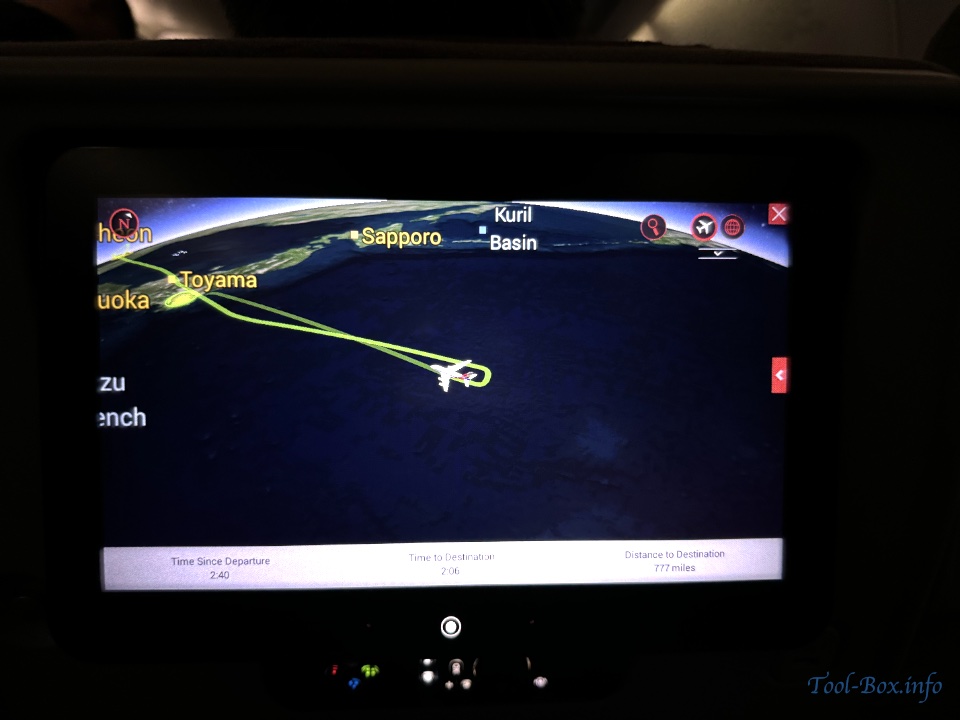
The trip wasn't easy, as the plane I took had one of the passengers falling ill mid-flight, causing an emergency landing in Tokyo Narita Int'l Airport and making the trip 6 hours longer than originally planned. Thankfully, I was able to arrive at the store before closing.