Reducing water usage (Part 1)

Softrong SKJ-60 kitchen faucet and SH-50 shower head

Not being content with just saving electricity, I looked for more ways to reduce monthly bills. There were two major pay-by-usage categories left: heating and water. With heating during last winter, I did some active manual adjustments instead of blindly relying on the thermostat, resulting in significant savings compared to last year. Sadly, it would be difficult to write this up. With water, there needed to be either some change of habits or hardware to see improvements. I did find the right hardware for the job, so I'm going to tell you about it.

Tiny rounded triangular holes produce strong streams with less water

It wasn't that my family members were particularly wasteful in terms of using water. In fact, overall water usage was consistently below average for the apartment complex. But hot water usage was above average. I guessed that this was due to heavy reliance on hot water during showers and dishwashing. So I bought some water-saving faucets from a company called Softrong in late February. By puncturing tiny, 0.25mm (0.01") holes on a stainless steel sheet for water to come out instead of using wider (~1mm) plastic-molded holes, the faucets supposedly produce stronger streams with less water, significantly cutting the amount of water used.
Continue reading "Reducing water usage (Part 1)"

Tracking down electricity draw (Part 4)

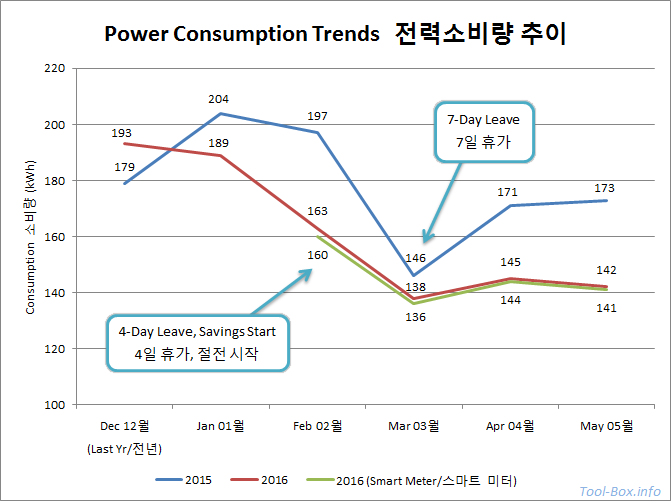
Comparison of the electric power consumption trends between 2015 and 2016

It's been about five months since I installed Seojun Smart Meter at home and took various measures to cut down unnecessary electricity use. Now was a good time to see if the smart meter was recording monthly data accurately, and whether my efforts panned out well. This graph sums up everything that needs to be said.

In terms of accuracy, the smart meter consistently reported slightly lower than the default meter installed in the premise. However, it is more less in line with the advertised margin of error (1%) after the initial month and thus I think it's reliable. This is important because the companion app effectively shows last month's finalized data a full month before it shows up in the bill, and the app also shows the forecast for this month. Now I know that these values can be trusted and I can prepare two months ahead.

Moving onto the consumption trends, my home generally spent around 190 to 200kWh in winter, then fell down to the 170kWh range in spring if the family didn't go out on a vacation. This is already somewhat below average for a 4-person family, but I started making the house even less wasteful starting in February this year by making more efficient use of the appliances and changing the lightings and bulbs to LED. Eventually, it has settled to somewhere between 140 to 150kWh per month now. This is a saving of roughly 30kWh, or more than 15%.

Thanks to this and being much more aware of the consumption in real time, I'm expecting about 30% savings in electricity costs in the summer when the air conditioning is in full operation. Home electricity rates in Korea is pseudo-exponential, so you pay a lot less for seasonal increase if you start out from a lower baseline. Recently, I helped my dad cut down power use at his house by lowering the baseline by roughly 200kWh and I think it'll save him at least US$300 per month during summer. I'm expecting that the money that went into the streamlining will pay for itself in 3 years. Overall, I'm satisfied with the results of the efforts I put in.
Defined tags for this entry: , ,

A year with Apple Watch & Yunmai Smart Scale

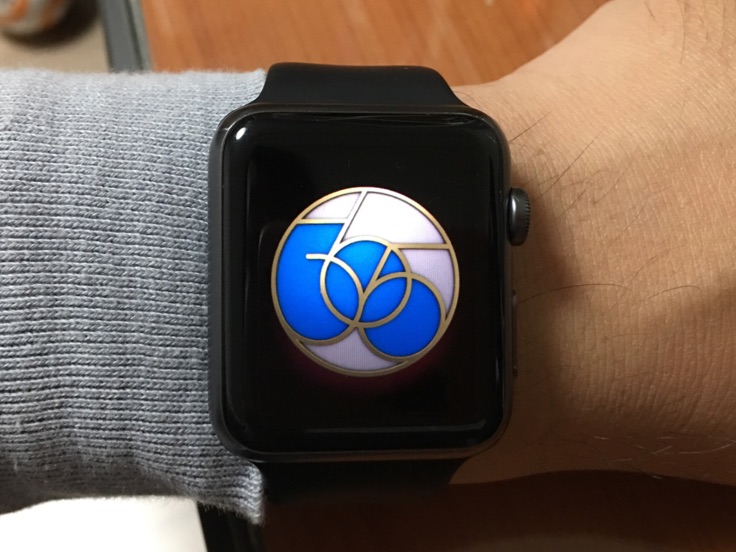
Achieving one full year of hitting daily Move goals with Apple Watch

It's now been one full year since I started wearing Apple Watch Sport and now is a good time to give you an update. I have been wearing it all the time except when it needs to be charged, so it has been through a lot. Daily showers and occasional swimming sessions may have caused a bit of degradation on the left edge of the screen, and an encounter with a rough surface left the glass with noticeable scratch lines. Despite all this, it's holding up well and functioning normally. I'll probably send the device in for replacement using AppleCare+ after I buy the next version, though.

In terms of battery life, it has consistently delivered at least 24 hours of use for me, except during early watchOS 2.0 betas. So I'm now accustomed to about 22 hours of use (with about 10 to 30% left as I take it off) and 2 hours of charging. The only times I wish the battery life was longer is when I do long-distance travelling, where the active time might stretch beyond 30 hours.

As for its uses, I've settled on the watch mainly being a quick notification-response device and a fitness tracker. Those two functions currently work fairly well. Meanwhile, the native app support with watchOS 2 has been hampered with the relatively slow performance. It often makes me want to reach for my iPhone instead of loading the relevant app on the watch. This needs to be addressed in the near future if Apple Watch is to be taken seriously beyond being an "accessory."

Now, the fitness tracker part of the watch was something I was looking forward to when I bought it. I have lost weight through exercise before, but lack of reminders once the goal was reached resulted in regaining some of that weight after a few months. So I decided to make good use of Apple Watch to keep me stay fit. I made sure to reach the daily Move goal every day, which had been set to 450 kcal after the first month. Missing this goal only a couple of times, I was able to earn the "365" badge you see above two days ago. Let's see the activity and weight trends in detail.

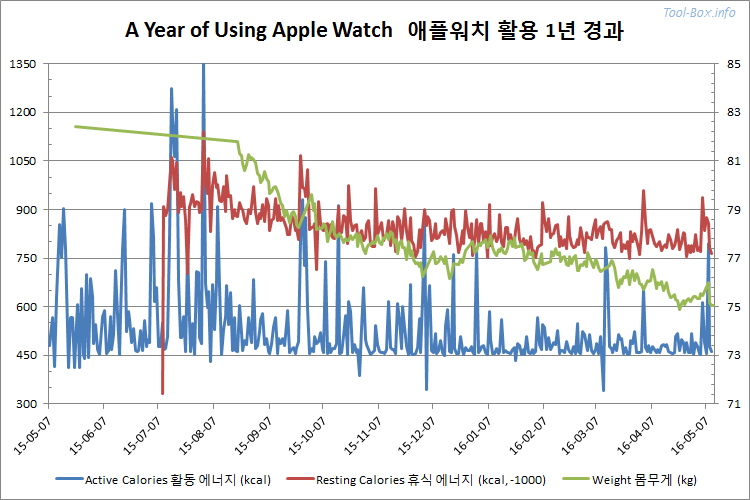
A Year of Using Apple Watch - graph of active & resting calories and weight trends
Why did I choose the 450 kcal mark? This is generally about 200 kcal more than I would normally burn through a normal day. 50 minutes of walking or 20 minutes of jogging can fill that in - these activities can easily blend into the daily routine and also conveniently make me reach the 30-minute Exercise goal in the process. Basically, I can get the bare minimum amount of exercise that Apple Watch recommends via its three-ring system with that setting. The graph evidently shows that I don't actively seek out to go beyond this goal unless something else is going on, like when I'm traveling. Some of the big spikes correlate to my overseas trips - New Zealand in May (2015), UK in July, and Japan in September, to name a few.

As a side note, the data for the resting calories starts on July 9 because this is when watchOS 2.0 beta 3 came out and made Apple Watch start recording this data on iPhone's Health database. Before that, the data resided only within the Activity app, likely because it was rudimentary and static, not to mention less accurate - it was about 40 to 50% more than expected. Since the update, the resting calories data is recorded in real time and seems to be more in line with the mainstream calculations.

Interestingly, I noticed that just reaching the Move and Exercise goals wasn't doing a particularly good job of shedding the weight in the early months. I did have a weight scale and occasionally checked my weight with it, but it hovered between 83 and 84kg without any upward or downward trend during that time. Besides, I never got around to recording the data anyway. The only data point during the period was from the annual check-up at my workplace. I decided to do something about it and got myself a so-called "smart scale" with Bluetooth connectivity in August.
Continue reading "A year with Apple Watch & Yunmai Smart Scale"

Tracking down electricity draw (Part 3)

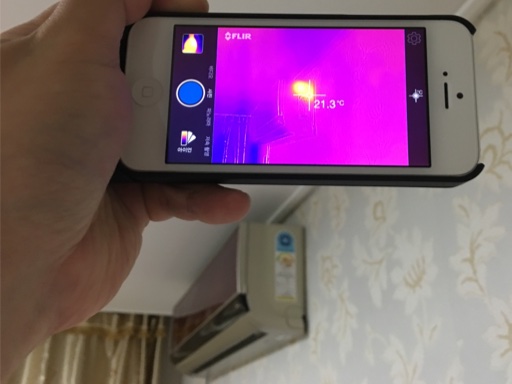
Thermal imaging shows the air conditioner's standby power turning into heat

As the hunt for even more potential waste of power continued, I brought in the help of thermal imaging technology. By scanning each place with a thermographic camera attached to an iPhone (FLIR One; I'll write about this later) I can find any hot or cold spots that seem to be out of place.

One of such "hot" spots I found was on the side of an air conditioning unit. It wasn't being used, but standby power drawn from the wall outlet was slightly heating up the control circuit and was readily visible via thermal images. I could just pull the plug until summer, but I decided to take a step further.

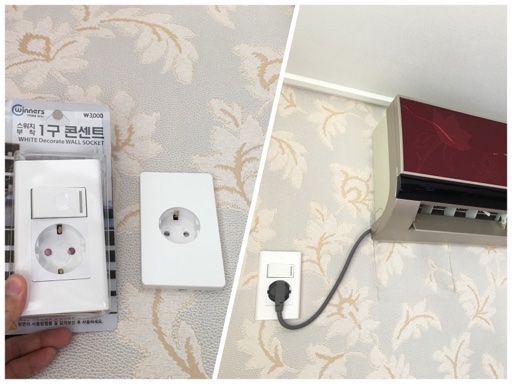
Installing a wall socket with a switch so the air conditioner won't use standby power

I replaced the default wall outlet with the one that had an integrated switch. This way, I could cut the power from the outlet with a switch when the air conditioner isn't in use, instead of having to pull the plug. Not only would this be simple to operate, it would avoid the mechanical wear. I should have done this ages ago.

As part of my ongoing data collection, I then tried to measure how much power the air conditioners in the house would consume while trying to cool the house. Sadly, the rooms were not hot enough for them to start cooling the air. I'll have to check them out again when summer comes.
Continue reading "Tracking down electricity draw (Part 3)"

Tracking down electricity draw (Part 2)

Those lights on the power strips do consume power - two for about 0.5W

As it is the case with the houses these days, there are lots of electronic devices littered throughout my home, plugged into wall outlets and USB ports. Measuring how much power these consume in their active and idle states would provide a good starting point in how to cut off unnecessary use of electricity. So that's exactly what I did over several days, and the results from the living room and computer/network equipment are now in. I'll be looking at other appliances as chances allow later on.

I tabulated the full results at the end of this post. But first, I'll talk about some interesting observations worth mentioning.

1. Beware of Light-Embedded Switches on the Power Strips

The lights on the switches of the power strips consume as much power as the devices capable of efficient standby - about 0.2 to 0.25W. This seems excessive for an LED, so I did a bit of searching. It turns out that most of these switches use neon lamps because the operating voltage is around 90V, making it relatively easy to integrate into 220V power using a simple resistor. With a nominal operating current of 1mA, the whole neon lamp + resistor assembly would consume 0.22W = 220V x 1mA.

LEDs, on the other hand, operate around 2 to 3V at 15 to 20mA, being about twice as efficient (neon: 90V x 1mA = 90mW, LED: 3V x 15mA = 45mW). But if you use a resistor to meet the voltage requirement, it would end up wasting much more energy (neon: 130V x 1mA = 130mW, LED: 217V x 15mA = 3,255mW). So you need a power converter instead, but they are neither as cheap or small as a tiny resistor. It's easy to see why neon lamps won out.

If your goal is to waste as little as possible, you would need to avoid having these lights on all the time. If six of these switches are always on, it would equate to about 1.3W, or about 1kWh per month of wasted energy. This is something to keep in mind when choosing a power strip for use in a room. If most of the stuff are used all the time or the standby power is low, it would be better to use a simpler power strip.

Docked smartphone as a desk clock isn't energy efficient - even if it's fully charged

2. Fully Charged Devices Still Leech Power

There are lots of handheld devices out there, and many of them are conveniently charged when placed on a dock. The problem is that even when the device is finished charging, the charging circuit still draws some power to keep the battery topped off.

For one thing, my electric shaver was found to be sitting idle and sipping nearly 1W for several hours even after being fully charged. Considering that it only takes a few minutes at most to get back to full after a shaving session, this seems to be an unneeded waste. I've changed my usage pattern so that I charge the shaver once every other week or so, and cut the power to the charger once I see that it's done its job.

Then there's the Motoroi smartphone that I've been keeping around its vertical dock as a desktop clock for about five years ever since it was no longer my main phone. The measurement showed that, even though it's kept fully charged, it was drawing about 1.2W from the USB hub all the time because the screen was always on. Like the power strip lights, this is enough to affect the last digit of my monthly electricity usage. So I decided to retire the old phone and replace it with a normal digital clock.

Similar to what was going on with Motoroi and the shaver, smartphones plugged into the dock were also found to sip a bit of power after a full charge. Unplugging it after charging seems to be the "smart" thing to do.
Continue reading "Tracking down electricity draw (Part 2)"

Copyright (C) 1996-2024 Woo-Duk Chung (Wesley Woo-Duk Hwang-Chung). All rights reserved.